The Covid19 pandemic has taken all of us by surprise. Within a span of a few weeks, the US stock market has dropped to a level that is beyond the Financial Crisis of 2008 and more reminiscent of the Great Depression while stock markets around the world from Hong Kong to Japan to Tokyo have experienced similar shocks. But the news has reported that in this stock market crash. The bigger companies are able to weather the crisis better due to having bigger reserves compared to the smaller/mid-size companies. So I am going to use data science to do a quick comparison using data to see if this is true or false.
In the US, there are 2 market indexes which are the S&P(Standards & Poor) and Russell 2000/3000 index. These 2 indices track large and small/mid-size companies’ stock prices. I use stock price as a proxy for the health of the company, but there are many factors involved such as cash reserves, amount of debt, etc. But to keep things simple and to get moving. I decided to get the total stock prices from the top 10 stocks from the S&P and from the Russell 2000 index. The top 10 stocks from the S&P are listed here https://www.investopedia.com/top-10-s-and-p-500-stocks-by-index-weight-4843111
The top 10 stocks from the S&P are
1 – Microsoft
2 – Apple
3 – Amazon
4 – Facebook
5 – Alphabet
6 – Google
7 – Johnson & Johnson
8 – Berkshire Hathaway
9 – Visa
10 – JPMorgan Chase
And the top 10 stocks from the Russell 2000 index which I have picked are listed here https://www.fool.com/investing/stock-market/indexes/russell-2000/
1 – Teladoc
2 – Novocure
3 – Generac
4 – Lumentum
5 – Trex
6 – Amedisys
7 – Portal General Electric
8 – Haemonetics
9 – First Industrial Realty Trust
10 – Deckers Outdoor Corp
I pull all stock prices from Yahoo Finance website where I downloaded the stock prices based on a 6 month time range which start from 7th Jan to 5th June 2020. The 2 CSV files can be downloaded here for the S&P and here for the Russell 2000.
So with these 2 csv files. I need to plot them on a graph to see how they look like first. So using Google’s Colab, Python and Panda. I started the import and reading of the CSV
import numpy as np
import matplotlib.pyplot as plt
import pandas as pd
dataset = pd.read_csv('S_n_P - V-2.csv')
X = dataset.iloc[:, 1].values.reshape(-1, 1)
y = dataset.iloc[:, 12].values.reshape(-1, 1)
Now, the CSV file show date, stock price and the total of the 10 companies. The graph needs to show date for X and stock price for Y. But Panda does not allow me to use date as a value when importing. So I modified my CSV to add in 1 more column day which is basically a sequence of running numbers starting from day 1 which is 7th Jan to the last day 5th June, which is day 105. This new day column is at index 1 while the stock prices are at index 12
Next, I plot the graph to see how the datapoint are displayed using this code
plt.scatter(X, y, color = 'red')
plt.title('S&P')
plt.xlabel('Day')
plt.ylabel('Price')
plt.grid(b=True, color='blue', alpha=0.6, linestyle='dashdot')
plt.show()
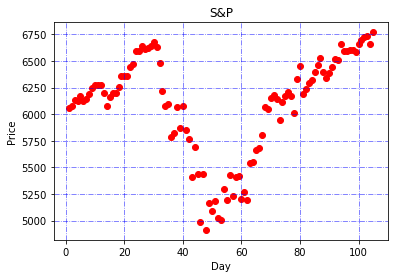
As you can see, you can see the stock price go up and then do a drastic fall in the center of the graph before heading up again.
With the graph of the top 10 stocks of the Russell 2000 index, we see this

The stock price goes up as expected and then down again at roughly the date range of the S&P graph show previously. So with these 2 graphs, it is hard for us to get more data since the data points are more or less pretty similar. Plus the graphs show the stock price going up and down and up, so a linear regression does not make sense as it will not reflect the up and downs of the data points. So I decided to use a polynomial regression instead and this is the code that I used
from sklearn.preprocessing import PolynomialFeatures
polynomial_reg = PolynomialFeatures(degree = 5)
X_polynomial = polynomial_reg.fit_transform(X)
lin_reg_2 = LinearRegression()
lin_reg_2.fit(X_polynomial, y)
Next, I add in these lines of code to show the curve and add more minor gridlines so that we can see the points betterplt.plot(X, lin_reg_2.predict(polynomial_reg.fit_transform(X)), color = 'grey')plt.minorticks_on()
plt.grid(which='minor', linestyle=':', linewidth='0.5', color='black')plt.grid(b=True, color='blue', alpha=0.6, linestyle='dashdot')
plt.show()
So with the S&P, we can see the curve in the graph

You will notice that the curve goes up to 6500 and then drops down to 5450 before heading up to 6750. This means there was a 16% drop at day 55 and then it goes up again to 6750 which is about a 3.8% increase from the initial high of 6500.
Now for the Russell 2000 curve, we get this

It goes to a high of about 1100 before dropping down to 950 for a 13% drop and then it goes up to 1110 for a 0.9% increase from the initial high of 1100.
This shows that both mid/small-cap companies and big companies have been equally impacted by the Covid19 crises as seen by the downturn of the curve. But mid/small-cap companies did not recover as much compared to the bigger companies. This could be due to reasons such as investor confidence and what they think of blue-chip companies, company cash reserves amongst other reasons. So this graph does show that mid/small-cap companies do tend to be affected to a greater extent in terms of recovery.
Ok, if you have seen the top 10 S&P stocks, a large majority of them are tech stocks such as Amazon, Microsoft, Apple, etc. Does that affect the recovery of the top 10 S&P stocks as a whole since most of the top 10 S&P stocks are tech stocks. So to do that, I decided to pull up the top 10 stocks from the tech-heavy NASDAQ via Yahoo Finance and the top 10 stocks are
1 – Apple
2 – Amazon
3 – Comcast
4 – Cisco
5 – Facebook
6 – Google
7 – Alphabet
8 – Intel
9 – Microsoft
10 -Nvidia
I have extracted out the data for NASDAQ stock and placed them here.
Next, we see how the graph lines up. Here is the graph taken from the top 10 stocks on NASDAQ

So the curve first tops up at 6240 and then it begins the decline to 5250 which is a 15.8% drop and then it rallies up to 6600 which is a 5% increase from 6240. This shows that tech stocks have a much higher recovery rate. This could be due to bullish investors who want to put money into companies which they deem to be safer such as tech stocks such tech companies are not so much affected by the Covid19 situation although stocks across the board have dropped due to investor confidence.
So with these 3 graphs, it would seem that there is some truth that bigger companies are more well equipped to weather the crisis caused by Covid19 as a whole, and tech companies have weathered this storm much better than others.
Here are the links to the CSV file that I used
Russell 2000 : https://gist.github.com/gibtang/f60fbcdc973f4fdf90e8a0f9edc668e3
Nasdaq :
https://gist.github.com/gibtang/8924b61c06043003d9d49d5aec842b73
S&P :
https://gist.github.com/gibtang/457b31db0feea1737fcac4ee99fa7678
And the code which I used for this article
https://gist.github.com/gibtang/62e854d6fb5976601193b089e8dc85d4